Updated
From 3.5% to 1.8% in Three Years: Masan's Robust Credit Profile Earns Senior Unsecured Status from 15 International Banks
June 08, 2026
Ho Chi Minh City, 04 May 2026 - Following the release of its unaudited management accounts, Masan Group Corporation (HOSE: MSN, “Masan”, “Group” or the “Company”) today published its management commentary for the first quarter of 2026 (“1Q2026”, “1Q”).
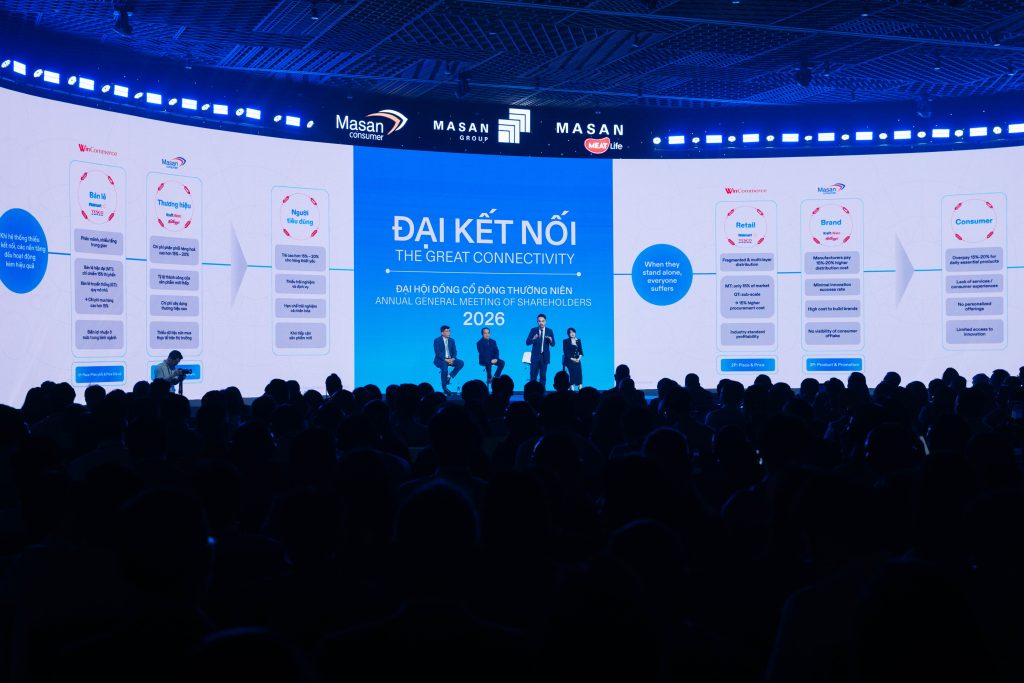
“A strong quarter - but the real value lies in our conviction for the future. The Consumer Operating System is no longer a thesis. It is working. Our retail engine connects 500,000 GT stores and thousands of WinMart locations. Our brand engine ensures every shelf carries brands built for Vietnamese consumers. Our digital engine connects them - every interaction smarter, every experience better, every price fairer. When three engines operate as one, the consumer wins: better products, better prices, better access. We are at the beginning of something significant - for Masan, and for Vietnam.”, said Dr. Nguyen Dang Quang, Chairman of Masan Group.
1Q2026 Key Highlights:
■ MSN delivered record 1Q profitability, with NPAT Pre-MI growing at 2.0x YoY.
■ WCM proved its role as a profitable growth engine, with revenue growing 29.4% YoY, and NPAT Pre-MI up 3.5x YoY.
■ MCH delivered double digit topline and bottom-line growth as Retail Supreme impact translated into tangible business results.
■ MSR delivered a major earnings turnaround, moving from a VND222 billion loss in 1Q2025 to VND537 billion NPAT Pre-MI in 1Q2026.
■ Assuming APT prices average approximately half of the 31 March 2026 spot price, net-debt-to-EBITDA is projected to improve from 3.5x in 1Q2026 to 1.7x by year-end FY2026 and 0.1x by year-end FY2027.
■ 2Q2026 preliminary momentum indicates MSN is on track to grow NPAT Pre-MI by approximately 60% YoY.
Business Commentaries:
■ 1Q2026 NPAT Pre-MI doubled YoY to VND1,974 billion, marking a record 1Q profit.
■ Consumer-retail EBIT rose to VND2,455 billion, up 23.6% YoY, reflecting broad-based growth across the platform.
■ Masan High-Tech Materials (UPCOM: MSR)’s EBIT grew nearly eightfold YoY, driven by ammonium paratungstate (“APT”) prices reaching USD3,150/mtu as of 31 March 2026 and material improvement in operating performance.
■ Techcombank (HOSE: TCB)’s EBIT also increased 11.8% YoY, while net financial expenses decreased by VND110 billion YoY, down 11.1% YoY, reflecting improved Group-level debt management. These gains were partially offset by increased provisions for investments.
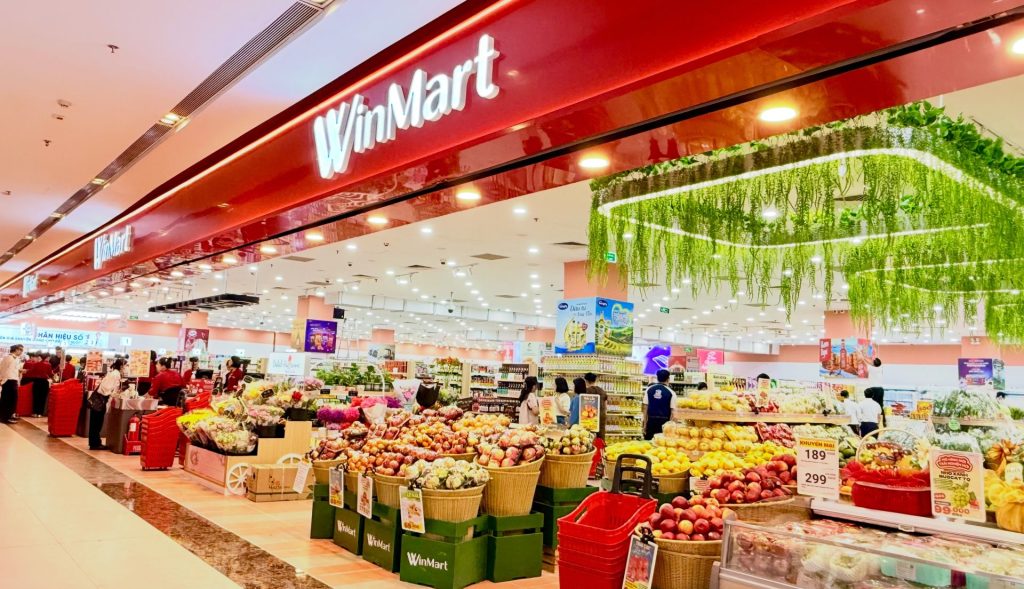
■ WinCommerce (“WCM”) delivered NPAT Pre-MI of VND204 billion in 1Q2026, up 3.5x YoY, equivalent to a 1.8% margin, driven by higher store traffic, disciplined network expansion and operating leverage.
■ WCM recorded a net addition of 225 new store openings (“NSOs”) for 1Q2026, bringing the total store count to 4,817 nationwide, with 100% of NSOs surpassing store‑EBITDA breakeven level within the quarter.
■ Like-for-like (“LFL”) growth across all formats was primarily driven by higher store traffic (bill count) as modern trade (“MT”) penetration accelerates:
▪ Minimarts delivered LFL growth of 11.8% YoY in 1Q2026, up from 8.6% in 1Q2025.
▪ Supermarkets delivered LFL growth of 19.9% YoY for 1Q2026, up from 6.1% in 1Q2025, supported by renovations that lifted store traffic, and achieved EBIT-positive with 3.5% margin, up 386 bps YoY. As of March 2026, 60 supermarkets have been renovated, with the remainder on track for completion by year-end.
■ Rural minimarts continued to be the primary growth engine, delivering 15.6% LFL growth - primarily traffic-driven - and accounting for 87% of NSO YTD. Rural minimarts LFL ADS reached ~96% of urban minimarts level in 1Q2026, reflecting strong consumer adoption in rural areas and validating the format’s scalability into underserved markets.
■ WCM continued to demonstrate strong cash discipline, with net working capital reduced by 5 days YoY in March 2026 to -7 days. The business remained net cash positive, enabling rapid expansion without balance sheet pressure.
■ Masan Consumer (HOSE: MCH)’s 1Q2026 revenue reached VND8,472 billion, up 13.1% YoY, while NPAT Pre-MI reached VND1,800 billion, up 11.5% YoY. Growth was broad-based across channels and categories, with GT returning to growth, up 11.0% YoY, as Retail Supreme translated into measurable business results.
■ Retail Supreme demonstrated clear improvements across key execution metrics as March 2026: 1) Coverage - Active selling outlets (“ASO”) reached approximately 500,000, up 2.3x compared to before Retail Supreme; 2) Penetration - SKU per order reached 5.5 (up 17.0%); approximately 57,000 outlets now carry around six or more categories, up 2.0x; 3) Perfect Stores - approximately 50,000 outlets are implementing MCH’s in-store execution standards, up 1.8x. The retailer incentive scheme driving cross-category SKU penetration is generating approximately 12x ROI, validating the commercial scalability of the model.
■ Retail Supreme is scaling without a structural increase in cost-to-serve - selling expenses as a percentage of revenue remained broadly stable YoY. As category penetration improves, incremental sales are expected to drive stronger operating leverage and improve ROIC over time.
■ By category, HPC led growth at 34.2% YoY, driven by Chanté and Homey penetration; followed by Seasonings at 17.1% YoY growth - with Fish Sauce contributing approximately 80% of category growth - and Convenience Foods at 13.9% YoY growth led by an accelerated premiumization trend. Global Business grew 11.3% YoY; while Bottled Beverages declined 2.8% YoY but improved sequentially versus 4Q2025, with Retail Supreme’s on-premise expansion expected to be the primary growth lever ahead of peak season.
■ MCH’s margin profile remained resilient. Gross margin was stable YoY at 46.7%, as favorable product mix offset the cost impact of ongoing product premiumization upgrades; disciplined, selective pricing actions on premium Fish Sauce and Granules in early 1Q2026 supported sequential improvement versus 4Q2025. EBIT margin was broadly stable - temporarily higher logistics costs reflected the transition period to a more centralized Group logistics model. NPAT Pre-MI margin followed a similar YoY trend to EBIT, reaching 21.2% in 1Q2026.
■ For further details, please refer to MCH’s standalone earnings release available on MCH’s website.
■ Masan MEATLife (UPCOM: MML) delivered revenue of VND2,479 billion in 1Q2026, up 19.8% YoY, with NPAT Pre-MI of VND147 billion, up 27.2% YoY. EBIT grew 3.0x YoY to a 7.4% margin, up 450 bps YoY, as both fresh and processed meat benefited from improved economies of scale and higher porker utilization.
■ Revenue reached VND2,479 billion, up 19.8% YoY, driven by strong growth in fresh meat, up 24.0% YoY, and processed meat, up 28.7% YoY, supported by deeper synergies with WCM and continued innovation-led expansion.
■ Fresh meat grew 24.0% YoY and processed meat grew 28.7% YoY. Total MML sales at WCM grew 30.2% YoY. More importantly, growth was not diluted by WCM’s network expansion of 989 net new stores-average daily sales per LFL store reaching VND2.3 million, up 19.8% YoY, reflecting stronger execution within the existing store base.
■ Within processed meat, Heo Cao Boi (nutritious snack) grew 34.9% YoY and Ponnie (young / trendy) grew 18.2% YoY, reflecting broad-based brand momentum across MML's innovation portfolio and demonstrating that innovation is becoming a repeatable growth driver rather than a one-off launch effect.
■ More broadly, 1Q2026 reinforced MML's ability to drive growth through brand building and value-added offerings - from fresh meat to sausages, snacks, marinated, and ready-to-cook products - improving porker utilization and supporting a more resilient, brand-led profit model.
■ NPAT margin growth was softer than EBIT growth, mainly due to a non-recurring, non-cash income item recorded in 1Q2025, representing part of the benefit from the renegotiation of a long-term commercial agreement with a supplier.
■ Phuc Long Heritage (“PLH”) posted net revenue of VND569 billion in 1Q2026, up 34.0% YoY, with EBITDA margin at 20.8% and NPAT Pre-MI growing 1.6x YoY to a 10.3% net margin, up 260 bps YoY. Growth was driven by delivery scaling and stronger in-store productivity gains, with LFL ADS in standard-format stores reaching VND26.3 million, up 21.2% YoY.
■ Delivery revenue grew 67.2% YoY in 1Q2026, contributing 32.7% of retail revenue, up 690 bps YoY. Delivery has expanded consumption occasions beyond in-store visits and remains a key top-line growth driver, supported by deeper partnerships with delivery platforms to improve coverage and consumer convenience.
■ Drinks revenue grew 32.6% YoY and accounted for 85.7% of retail revenue in 1Q2026. Importantly, this growth was not driven only by the drinks category itself, but also by broader improvements in overall store productivity and customer experience, which helped drive stronger traffic and higher spending across stores. Food categories-including bakery, pastry, ice cream, and yogurt-remained stable at 7.9% of retail revenue, continuing to support basket building and more diversified consumption occasions.
■ PLH opened 3 new standard-format stores in 1Q2026, bringing the total store count outside WCM to 205 nationwide. PLH still targets to open 40 to 50 NSOs in 2026, with store openings expected to accelerate in the latter half of the year. Meanwhile, LFL ADS of standard-format reached VND26.3 million, up 21.2% YoY.
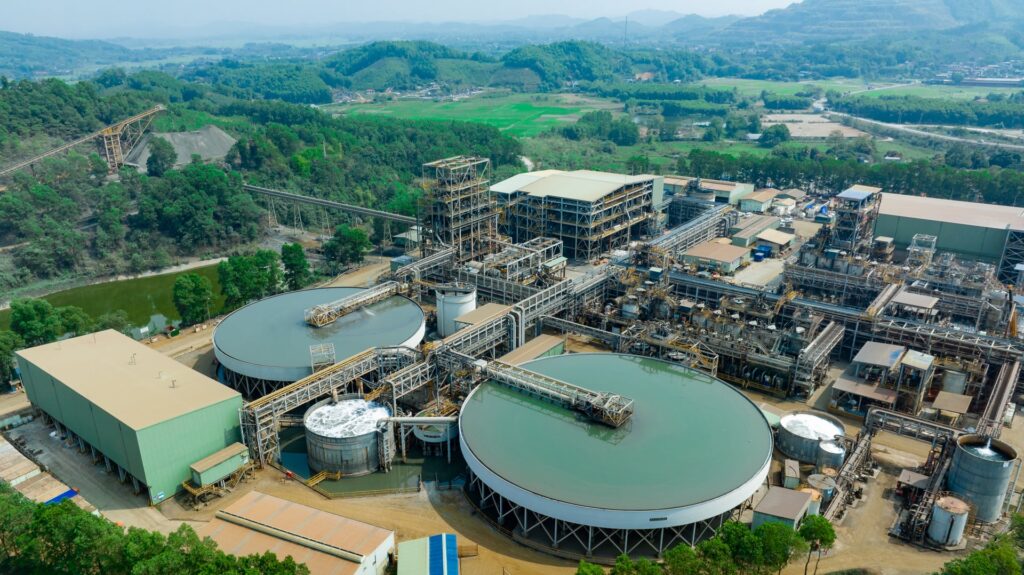
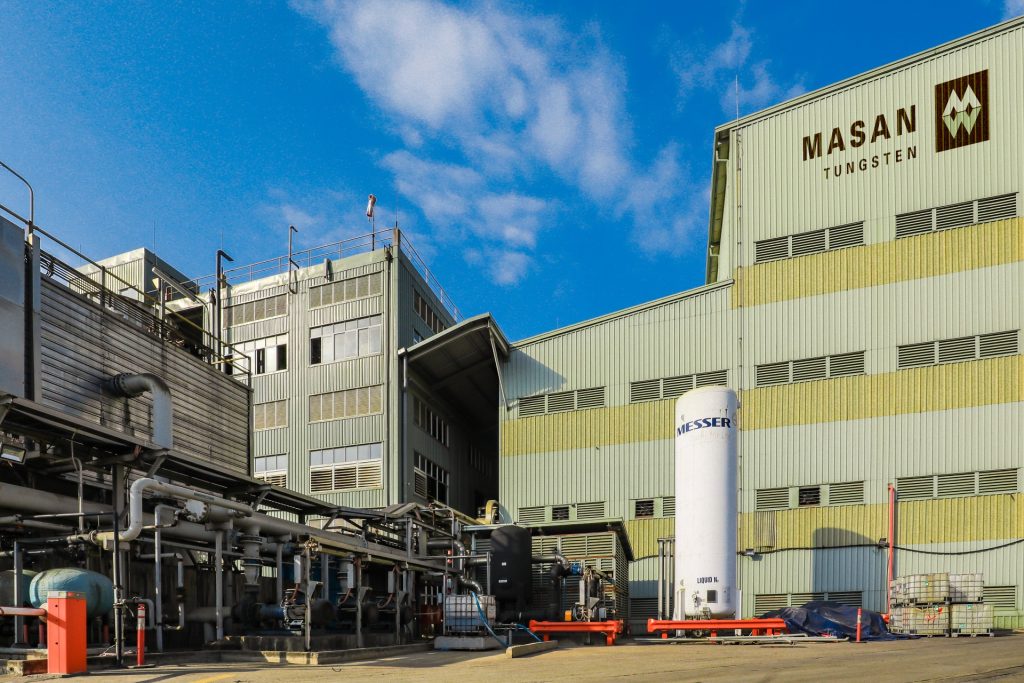
■ MSR delivered a record quarterly NPAT of VND537 billion in 1Q2026, compared with a VND222 billion loss in 1Q2025, supported by stronger commodity pricing, improved operating performance, and lower net interest expenses.
■ Net revenue reached VND2,993 billion, up 114.9% YoY, led by APT revenue of VND2,445 billion, up 3.2x YoY. APT averaged USD1,865/mtu in 1Q2026 and reached USD3,150/mtu as of 31 March 2026, compared with MSR’s revised 2026 budget assumption of approximately USD1,200/mtu. In the event current price levels are sustained for the rest of the year, MSR expects to achieve materially better financial results.
■ EBITDA margin expanded to 35.1%, up 540 bps YoY, driven by higher APT prices, cost discipline, and improved tungsten and fluorspar recoveries, despite lower ore feed and throughput in 1Q2026. NPAT also improved due to stronger EBITDA and lower interest expenses following debt reduction.
■ Throughput is expected to recover from 2Q2026 and ramp further in 3Q2026 following the amendment of the 28-million-ton mining license, with full-year ore processed projected to exceed FY2025 levels.
■ MSR is expected to generate stronger operating cash flow and accelerate deleveraging, with revised guidance indicating net-debt-to-EBITDA declining from 3.5x in 1Q2026 to 1.7x by year-end. Assuming APT prices average above USD1,500/mtu, MSR targets net-debt-to-EBITDA of 0.1x by end-2027, and conservatively net cash position by end-2028, which would create room for lower interest expenses, higher earnings quality, and potential dividend payments in the upcoming years.
■ Masan has announced plans to migrate MSR to the HOSE mainboard, aiming to enhance value recognition, broaden the shareholder base, improve liquidity, and support strategic investor engagement.
■ For further details, please refer to MSR’s standalone earnings release available on MSR’s website.
■ MSN’s profit share of Techcombank (HOSE: TCB) in 1Q2026 was VND1,316 billion, up by 11.8% YoY. For detailed results on TCB’s performance, please refer to the bank’s website.
Consolidated Financial Results:
■ Net Revenue: Masan Group’s net revenue in 1Q2026 reached VND24,020 billion, up 27.1% YoY, driven by double-digit topline growth across the consumer retail businesses along with significant uplift from MSR benefiting from higher APT prices.
■ EBITDA: EBITDA reached VND4,976 billion in 1Q2026, representing a 24.3% YoY increase, driven by profitability momentum across consumer-retail businesses, MSR, and TCB.
■ NPAT: Pre-MI earnings reached VND1,974 billion, while post-MI earnings totaled VND1,246 billion in 1Q2026, marking 100.8% and 216.6% YoY growth, respectively.
■ Balance Sheet Highlights:
■ Cash and Cash Equivalents declined to VND13,232 billion in 1Q2026, down 24.5% from VND17,527 billion in FY2025, primarily due to minority dividend payouts at MCH, interest expenses, and fixed income investments to enhance yield as per the Company’s treasury management policy. This was partially offset by stronger operating cash flow and proceeds from secondary sales of bonds issued by the Company and its subsidiary.
■ Consolidated debt increased to VND65,037 billion in 1Q2026, up 1.2% from VND64,236 billion in FY2025, driven by secondary sales of bonds issued by the Company and its subsidiary, as well as net short-term borrowings to support working capital.
Balance Sheet Highlights:
■ Cash and Cash Equivalents declined to VND13,232 billion in 1Q2026, down 24.5% from VND17,527 billion in FY2025, primarily due to minority dividend payouts at MCH, interest expenses, and fixed income investments to enhance yield as per the Company’s treasury management policy. This was partially offset by stronger operating cash flow and proceeds from secondary sales of bonds issued by the Company and its subsidiary.
■ Consolidated debt increased to VND65,037 billion in 1Q2026, up 1.2% from VND64,236 billion in FY2025, driven by secondary sales of bonds issued by the Company and its subsidiary, as well as net short-term borrowings to support working capital.
■ Net Debt to LTM (last 12 months) EBITDA rose to 2.84x in 1Q2026 compared to 2.70x in FY2025. The Company remains within the commitment of ≤3.5x and is on track to achieve its longer-term deleveraging path towards 2.0x.
■ MSR is expected to be a key driver of this deleveraging trajectory, supported by favorable commodity prices and stronger operating cash flow. Revised guidance indicates MSR’s Net Debt to EBITDA declining to 1.7x by year-end from 3.5x in 1Q2026. Assuming APT prices average above USD1,500/mtu, MSR targets Net Debt to EBITDA of 0.1x by end-2027, and conservatively net cash position by end-2028.
■ LTM free cash flow (“FCF”) reached VND11,311 billion as of 1Q2026, up 21.5% compared to FY2025, driven by stronger operating cash flow across consumer-retail businesses, MSR, partially offset by higher LTM capex. In 1Q2026, capex rose to VND447 billion, up 28.5% YoY, to fund overall business growth and expansion.
Preliminary view on 1H2026:
■ Building on a record 1Q2026, 1H2026 revenue and NPAT Pre-MI are estimated at VND51,500 billion and VND4,600 billion, up 38% and 76% YoY, respectively.
■ In consumer-retail, growth is expected to remain broad-based in 1H2026: WCM is expected to deliver 27% YoY revenue growth, supported by LFL growth and 700 NSOs, with NPAT margin improving 120 bps YoY to 1.5% despite lower QoQ margin in 2Q due to demand seasonality and higher energy costs; MCH is expected to deliver 21% YoY revenue growth with a 20% NPAT margin, supported by Retail Supreme, core relaunches, and disciplined revenue management; MML revenue is expected to grow 18% YoY with EBIT growth of 2.1x YoY, driven by fresh and processed meat momentum; and PLH revenue is expected to grow 33% YoY, with EBIT growth of 58% YoY, supported by LFL growth, delivery, membership, and accelerated 2Q’s NSOs.
■ MSR should remain a meaningful contributor to consolidated profitability and deleveraging. Based on April performance, MSR 2Q2026 profitability is estimated at approximately VND690 billion, reflecting a slight QoQ improvement. Profit contribution is expected to strengthen further in 2H2026 as ore processed levels recover and ramp up in 3Q2026 following the amendment of the 28-million-ton mining license.
■ MSN expects stronger operating cash flow generation in 1H2026, reaching approximately VND6,200 billion, up approximately 60% YoY, supported by higher subsidiary-level profitability and continued working capital discipline. This reinforces MSN’s ability to reinvest behind high-ROI consumer-retail growth, reduce leverage, and create greater flexibility to evaluate capital return options, including dividends, in line with balance-sheet priorities.